Image vs Video Ads: Static Images Over-Index 1.5× Among Long-Running Winners
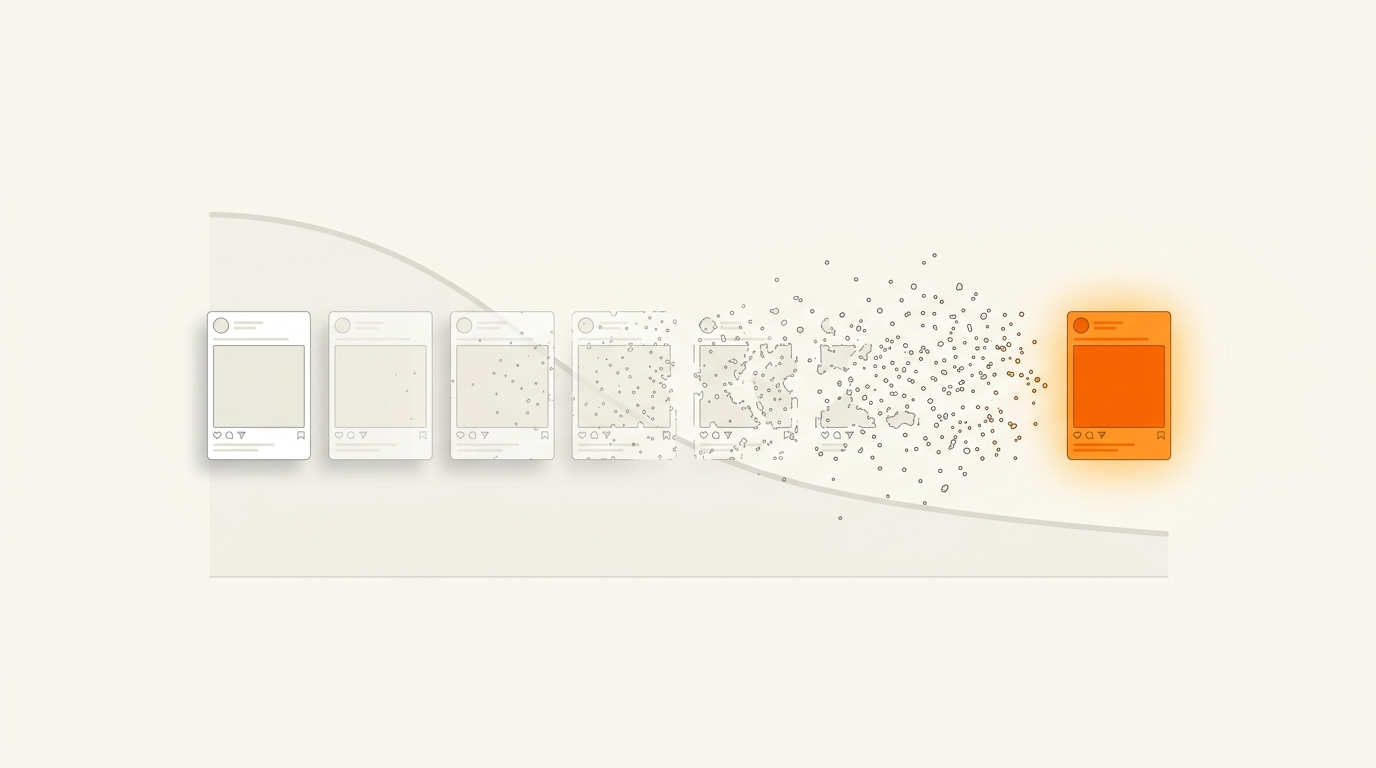
Everyone says video wins. Our tracked data disagrees: static image ads make up 40% of all ads but 59% of the ads that survive 30+ days. Here's the breakdown and why it happens.
The contrarian result
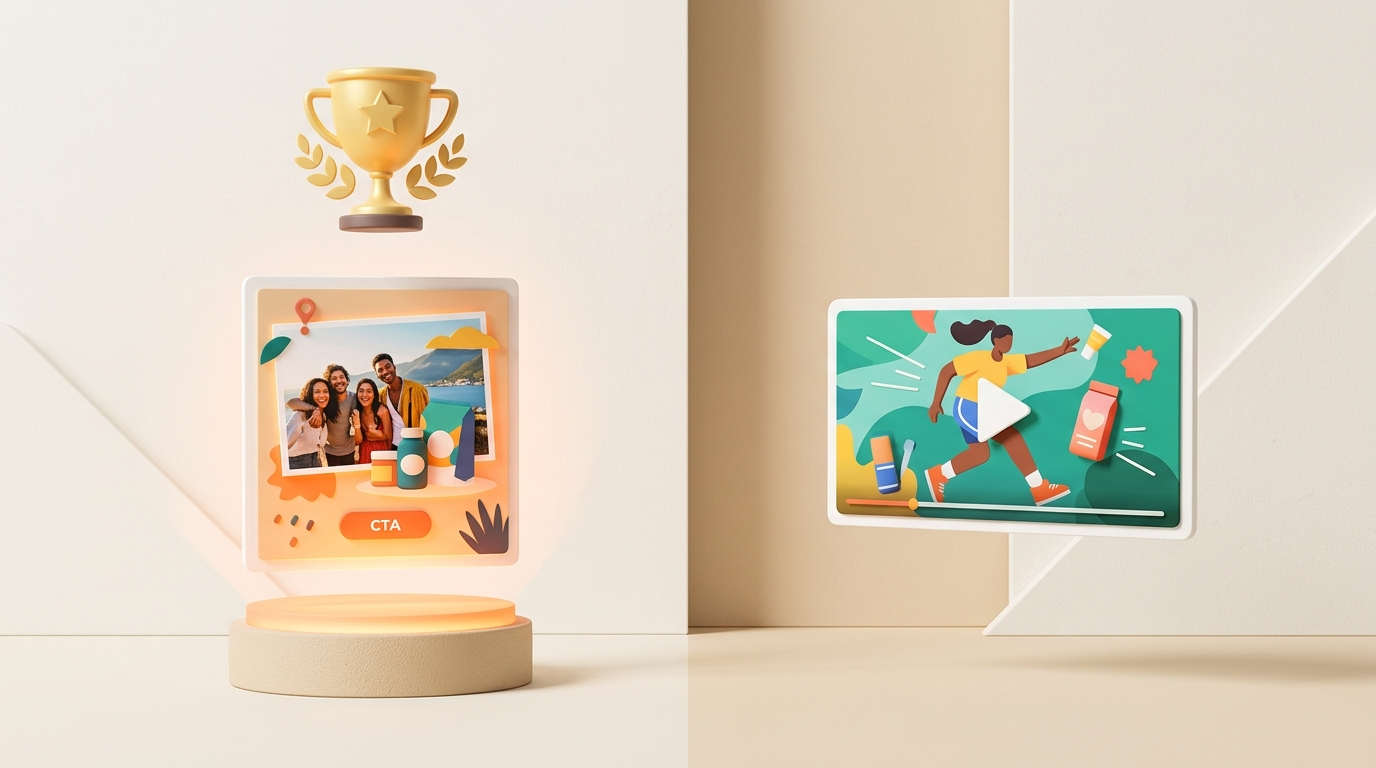
The advice is everywhere: "video outperforms static." Platforms push it, agencies preach it, and creators sell it. But when we looked at which ads actually stay in market the longest, the data pointed the other way.
Across the TrackCreatives research index of 17,900+ tracked ads:
| Format | Share of ALL tracked ads | Share of 30-day WINNERS | Over/under-index |
|---|---|---|---|
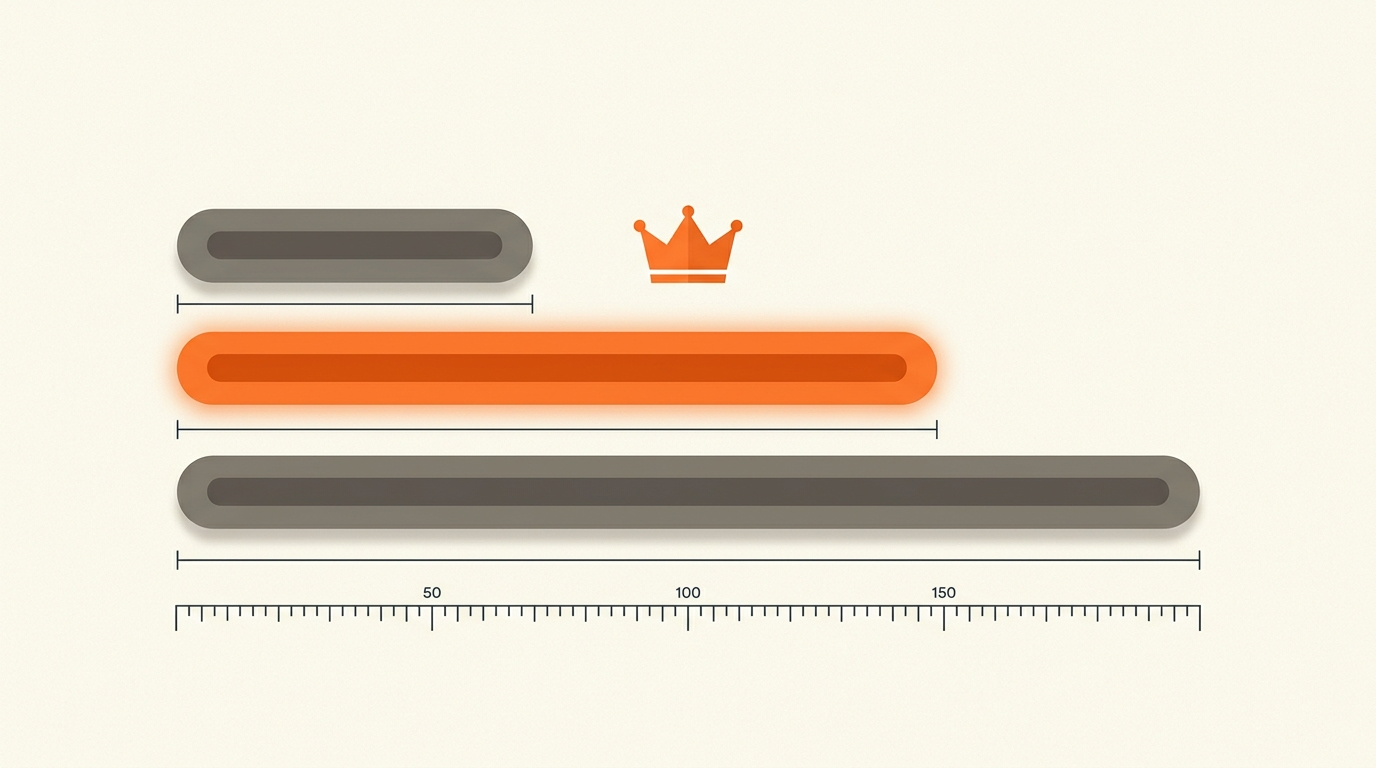
| Static image | 40.0% | 59.0% | +1.5× |
| Video | 44.8% | 30.8% | −0.7× |
| Carousel | 15.2% | 10.2% | −0.7× |
Static image ads are 1.5× over-represented among ads that survive 30+ days. Video — the format with the most hype — under-indexes among the survivors.
Why images outlast video
1. Images fatigue slower. A video's hook is consumed in the first watch; by the third impression, viewers skip. A strong static image with a headline keeps working as a billboard — it does not depend on stopping the scroll for 15 seconds, only for one.
2. Video is where testing churn lives. UGC and short-form video are cheap to produce in volume, so advertisers rotate them aggressively. Many video ads are born disposable — they were never meant to run 30 days.
3. The surviving images are direct. Read the 30-day image winners and a pattern repeats: one clear claim, one product visual, one CTA. They behave like search ads wearing a display format — intent-driven, not entertainment-driven.
What this does NOT mean
This is longevity data, not CTR data. Video still wins attention metrics in most platform studies, and a great video can absolutely be a winner (30.8% of our winners are video). The takeaway is narrower and more useful:
A strong static image is the most durable ad asset you can make. If you can only produce one thing this week, the data says make the image.
How to apply it
- Pair every video campaign with a static distillation of the same hook — the image usually outlives the video.
- Study 30-day image winners in your niche before briefing designers; they encode what your market already rewards.
- Judge carousels hardest: they under-index among winners and cost the most to produce.
Methodology
Formats read from ad-library creative metadata across 17,978 tracked ads; winners = 1,217 ads observed actively running 30+ days after first observation. Format shares among winners: image 718, video 375, carousel 124. Snapshot August 2026.
Cite this study: TrackCreatives Image vs Video Ads Study, 2026 — trackcreatives.com/blog/image-vs-video-ads-study.
Run this research on your own niche
Track any competitor. Surface the 30-day winners automatically.
Start tracking winners →